


Throughout the country, interest in energy storage systems is increasing. In fact, residential energy storage installations increased 500% from 2017 to 2018, according to the Smart Electric Power Alliance (SEPA). Nowhere is this more apparent than in California, where energy storage has truly taken off.
California publishes both application and interconnection data for the Self Generation Incentive Program (SGIP), as well as for other state-led initiatives such as net metering interconnections. Given the size of the state’s energy storage market and the recent expanded interest for storage in state, an analysis of this publicly available dataset is a great way to get a feel for the trends in the residential energy storage industry.
Note: You can replicate this analysis by downloading up-to-date SGIP application data online. I’m focusing here on residential electrochemical storage, excluding applications that have been cancelled. I recognize that not all applications ultimately become installations (or that there may be variance between the application and the installation), but this dataset is more robust than the less-frequently released dataset of installed systems.
Here are my three biggest takeaways:
More capacity over fewer applications
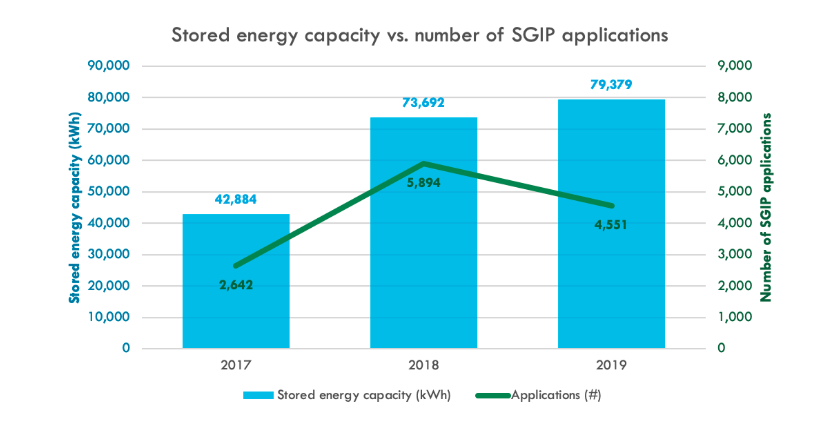
Year-to-date, SGIP applications in California are on pace to be slightly lower than in 2018: through early November, there have been ~4,500 residential SGIP applications compared to 2018’s ~5,900 applications.
However, the energy storage capacity of the systems in 2019 already exceeds that of 2018: last year, residential SGIP applications reached 74 megawatt-hours (MWh) of energy storage capacity; through early November, 2019 applications already total 79 MWh.
There are a couple of potential reasons for this difference. First, it could be that more homeowners are installing multiple batteries: each application is for a single site, so more batteries per home would lead to a reduced number of applications but a higher capacity.
A second reason is that different battery manufacturers produce batteries of different sizes. For instance, the LG Chem RESU 10H is rated at 9.3 kilowatt-hours (kWh) of DC stored energy, the Tesla Powerwall 2 stores 13.5 kWh of electricity. In other words, if the market share were to shift from one battery to another, the cumulative stored capacity would change too, which appears to be what has happened so far between 2018 and 2019.
Market dominated by two battery manufacturers so far
The storage industry remains nascent, though the number of market entrants is increasing every year. So far, though, SGIP application data indicates that the market is dominated by two primary manufacturers and their flagship batteries: the aforementioned LG Chem RESU 10H and Tesla Powerwall 2.
Over the last two years, these two batteries have combined to account for more than 97% of all SGIP applications. However, their relative market share shifted dramatically between 2018 and 2019: in 2018, LG Chem batteries were in 62% of applications; this year, Tesla is included in 58% of applications.

This sort of market dominance from only two entrants may imply that SGIP applications are primarily submitted by a few, large solar installation companies who have a clear preference for one of these batteries. For instance, Tesla installers are only going to attach Powerwalls to solar installations while installers from Vivint and SunRun only offer the RESU 10H.
However, the overall story is a touch more complex than that: in 2019, 49 solar companies have submitted at least 10 SGIP applications, while 8 have submitted 100 or more. So far, only two installers accounted for more than 10% of SGIP applications in 2019, which makes the state’s use of primarily just two batteries all the more surprising.
Stated pricing (for applications) increased in 2019
Although the cost of lithium-ion batteries has decreased by over 70% since 2013, and by about 80% since 2010 (depending upon which source you use for these metrics), SGIP application data from 2019 do not reflect these year over year price declines for the installed cost of a new battery system.
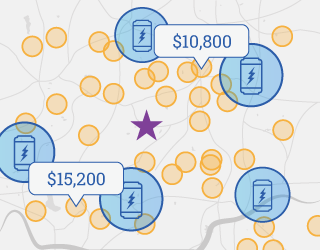
In fact, according to SGIP application data, the installed cost of both Tesla and LG Chem batteries has increased over 35% from 2018 to 2019 in California. The average installed cost of a Powerwall increased from just under $10,000 in 2018 to nearly $14,000 in 2019, while the average reported installed cost for a RESU 10H increased from $8,000 to about $11,000.

It’s also important to look at the cost per installed kWh. By this metric, both the Powerwall 2 and the RESU 10H increased to more than $1,000 per kWh in 2019, lower than the results of the most recent Lazard Levelized Cost of Stored Energy, but still much higher than the $/kWh of commercial installations.
There are many more insights to glean from the SGIP application data, and I plan to write additional articles analyzing the data in more detail. I look forward to seeing your analysis as well!
Thanks for reading.