


This week, EnergySage released its fifth Solar Marketplace Intel Report™. In this report, you’ll find trends on solar pricing over the past 12 months, as well as equipment and financing options for solar. In addition, this report includes new information about community solar and the level of solar interest in states across the country. Read on for some of the top takeaways relevant to today’s solar shoppers.
The trend continues: cost to install solar keeps falling
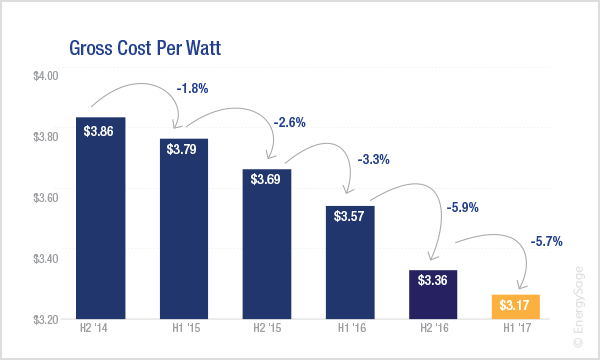
Installing a solar panel system for your home or business is cheaper than ever on EnergySage. Between the second half of 2016 and the first half of 2017, the average solar quote submitted to EnergySage solar shoppers dropped in price by 5.7%, from $3.36/Watt to $3.17/Watt. For an average-sized 6 kilowatt (kW) solar system, that’s the equivalent of a discount worth $1,140!
Some states saw prices fall even further over the same time period. In Florida, the average cost per watt fell by nearly 13%, while in Maryland it declined by over 8%.
Solar installation costs by state, H2 2016 and H1 2017
| State | $/W, H2 2016 | $/W, H1 2017 | % Change |
| Arizona | $2.97 | $2.82 | -4.9% |
| California | $3.38 | $3.28 | -3.1% |
| Florida | $3.03 | $2.64 | -12.9% |
| Illinois | $3.27 | $3.14 | -4.1% |
| Maryland | $3.11 | $2.86 | -8.1% |
| Massachusetts | $3.57 | $3.32 | -7.1% |
| Michigan | $3.26 | $3.20 | -1.9% |
| New York | $3.59 | $3.33 | -7.0% |
| Ohio | $3.01 | $2.80 | -7.0% |
| Rhode Island | $3.65 | $3.49 | -4.3% |
| Texas | $3.16 | $3.19 | 0.8% |
| Virginia | $3.02 | $2.74 | -9.2% |
These historically low prices mean that if you’ve been waiting to install a solar energy system on your property, now is the time to start comparing quotes. There are two main reasons why waiting even longer won’t save you more money:
1. Financial incentives are reduced as solar installations increase. While there are significant rebates, tax credits and other incentives in place today to encourage homeowners to go solar, incentives programs usually get phased out as solar becomes more popular and costs decrease.
For example, the state of Oregon is ending its lucrative state tax credit (worth $6,000) at the end of 2017, and Utah is also starting to phase out its tax credit for solar. Massachusetts’ SREC program (which can earn an average MA homeowner an extra $1,800 a year) will also be closed to new projects in early 2018.
Additionally, some state and local rebate programs, such as New York’s Megawatt Block Incentive Structure, decrease in value as more solar is installed. The longer you wait, the less likely it is that these incentive programs will be around.
2. Every year you don’t go solar means thousands of dollars in missed savings. If you wait to go solar, you’re stuck paying your utility electricity bill every month. The typical U.S. home spends about $1,400 a year on electricity. If you buy a system that meets 100 percent of your electricity needs today, you eliminate your utility electricity costs and have an extra $1,400 in your pocket a year from now.
Your savings will continue to grow for the 25 to 35 years that your system is operational. For every year that you don’t buy solar, you lose out on all those electricity bill savings!
You can afford those high-end solar panels: premium equipment doesn’t always come at a premium price
In this report, EnergySage compared the average price for the top 10 most popular equipment packages quoted to shoppers on the Solar Marketplace. What we found: while some packages were more expensive than others, the price difference between mid-range and high-end panels were negligible.

In this analysis, an equipment package that includes Hanwha Q CELLS solar panels and SolarEdge power optimizers served as the “base” price. You can see that packages with Hanwha, Canadian Solar, and SolarWorld panels all fell on the low end of the price range.
Interestingly, though, Trina Solar panels were only slightly less expensive than two high-end brands that offer high-efficiency solar panels: LG and Panasonic. For solar shoppers looking to maximize their solar investment, this is great news.
In states across the country, home solar panels offer less expensive energy than your utility
This edition of the Solar Marketplace Intel Report™ also included an analysis of solar economics for shoppers in six utility territories across the country: Portland General Electric (Oregon), Arizona Public Service, Georgia Power, PEPCO (DC & Maryland), PSEG (New Jersey), and Eversource (Massachusetts & Connecticut).

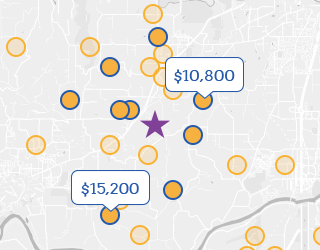
As you can see in the graphic, system sizes and the amount of monthly electricity needs met differed from region to region. In PSEG territory, solar shoppers could offset 92% of their electric bill by installing solar on their property, while in Georgia Power territory that number fell to 61.7%.
However, there was one major trend noticeable across every one of these regions: the per-unit cost of energy from a customer-owned solar panel system was significantly lower than the cost of electricity from the utility.
EnergySage calculated the levelized cost of energy (LCOE) for solar shoppers in each utility territory to get this data point. The LCOE is the average amount that you will pay for each unit of electricity that your solar energy system will produce over its entire lifetime. It’s calculated by dividing the cost of installing solar by the total number of kilowatt-hours the solar panels will generate.
In some cases, the LCOE was less than half the cost of utility-provided electricity in 2017. That’s just one of the reasons that EnergySage considers a solar panel system to be the best way to invest k.
Want to know more? Download the latest version of the EnergySage Solar Marketplace Intel Report™ on our data page. If you’re ready compare your solar options, join the Marketplace to start receiving multiple quotes from qualified pre-screened solar installers. On EnergySage, you’ll go solar with confidence.