


This week, EnergySage released its sixth Solar Marketplace Intel Report™. In this report, you’ll find trends on solar pricing for all of 2017, as well as equipment and financing options for solar. In addition, this report includes new information about what solar equipment quality people prefer. Read on for some of the top takeaways relevant to today’s solar shoppers.
Solar prices are still falling, but more slowly than before

Installing a solar panel system for your home or business is cheaper than ever on EnergySage, but prices aren’t falling as quickly as they were before. Between the first and second half of 2017, the average solar quote submitted to EnergySage solar shoppers dropped in price by 1.3%, from $3.17/Watt to $3.13/Watt. By comparison, average cost fell by 5.7% from H2 2016 to H1 2017, and by 5.9% over the previous six-month period.
The price declines varied from state to state, and many states saw prices fall more quickly than the national average over the same time period. In Texas, the average cost per watt fell by nearly 9%, while in Arizona and Michigan it declined by over 6%.
Solar installation costs by state, H1 to H2 2017
| State | H1 2017 | H2 2017 | % Change |
| Arizona | $2.86 | $2.68 | -6.2% |
| California | $3.32 | $3.22 | -3.0% |
| Connecticut | $3.32 | $3.25 | -2.3% |
| Florida | $2.66 | $2.53 | -5.0% |
| Massachusetts | $3.36 | $3.28 | -2.2% |
| Maryland | $2.87 | $2.74 | -4.6% |
| Michigan | $3.22 | $3.02 | -6.4% |
| New York | $3.40 | $3.38 | -0.5% |
| Ohio | $2.83 | $2.79 | -1.3% |
| Rhode Island | $3.53 | $3.44 | -2.5% |
| Texas | $3.22 | $2.94 | -8.6% |
| Virginia | $2.74 | $2.83 | 3.4% |
While these prices are lower than ever before, there are some signs that the tariff on foreign solar panels announced in January 2018 could cause prices to fall more slowly over the next few years. If you’ve been thinking about installing solar but haven’t started shopping, now is the time to start comparing quotes from installers near you.
The average shopper on EnergySage broke even on their solar costs in just 7.4 years – not bad for an investment that will continue to save you money for 25 to 35 years! In some states, the “payback period” for solar is even lower. In California, it was just 6.2 years on average, and in Massachusetts, it’s under 5 years.
Solar payback period by state, H1 to H2 2017
| State | H1 2017 | H2 2017 | % Change |
| Arizona | 7.7 | 6.9 | -11.4% |
| California | 6.5 | 6.2 | -4.3% |
| Connecticut | 8.2 | 8.0 | -2.4% |
| Florida | 9.7 | 9.3 | -5.0% |
| Massachusetts | 4.8 | 4.8 | 1.3% |
| Maryland | 8.0 | 7.9 | -1.2% |
| Michigan | 8.7 | 8.3 | -4.1% |
| New York | 8.1 | 8.6 | 5.3% |
| Ohio | 11.0 | 10.9 | -0.7% |
| Rhode Island | 8.1 | 8.4 | 3.8% |
| Texas | 11.9 | 11.8 | -0.4% |
| Virginia | 9.5 | 10.3 | 8.0% |
Though costs are falling, delaying your solar panel purchase won’t necessarily save you more money – financial incentives are being reduced as solar installations increase. While there are significant rebates, tax credits and other incentives in place today to encourage homeowners to go solar, incentives programs are being phased out as solar becomes more popular and costs decrease. Most notably, the federal tax credit for solar will be stepped down starting in 2020.
In states across the country, home solar panels offer less expensive energy than your utility
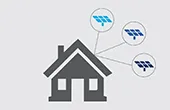
This latest edition of the Solar Marketplace Intel Report™ also included an analysis of solar economics for shoppers from five different utilities across the country: Green Mountain Power (Vermont), Pacific Power (California, Oregon, and Washington), Puget Sound Energy (Washington), San Diego Gas & Electric (California), and Tampa Electric Company (Florida).

As you can see in the graphic, system sizes and the amount of monthly electricity needs met differed from region to region. In San Diego Gas & Electric territory, solar shoppers could meet 100% of their electricity use by installing solar on their property, while in Puget Sound Energy territory that number fell to 62.7%.
However, there was one major trend noticeable across every one of these regions: the per-unit cost of energy from a customer-owned solar panel system was significantly lower than the cost of electricity from the utility.
EnergySage calculated the levelized cost of energy (LCOE) for solar shoppers in each utility territory to get this data point. The LCOE is the average amount that you will pay for each unit of electricity that your solar energy system will produce over its entire lifetime. It’s calculated by dividing the cost of installing solar by the total number of kilowatt-hours the solar panels will generate.
In almost every case, the LCOE was less than half the cost of utility-provided electricity in 2017. That’s just one of the reasons that EnergySage considers a solar panel system to be the best way to invest k.
—