


Last week, EnergySage released our seventh Solar Marketplace Intel Report™. Within the report, you’ll find a wealth of data regarding solar pricing trends, the most popular modules and inverters, and the growth in solar interest by state.
Trump Tariffs impose costs on homeowners
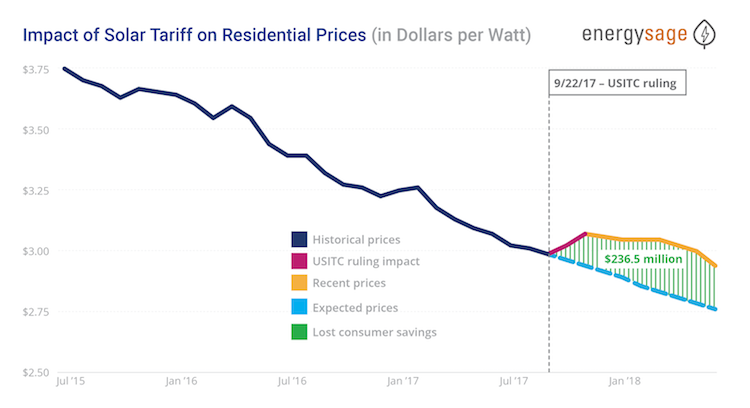
At a high level, the most important takeaway from the seventh Solar Marketplace Intel Report™ is that the Trump Administration’s tariff on imported solar panels has imposed a substantial tax on American residential solar customers.
We find that the cost of solar increased by an average of $0.16 per watt nationally as a result of the tariffs even before they were finalized. Prices first spiked after the US International Trade Commission finding that imported panels caused injury to domestic manufacturers, and have remained higher than expected throughout 2018.
For an average homeowner installing solar, the tariffs resulted in a $960 increase in the cost of a standard 6-kilowatt (kW) solar energy system. Across all of the residential solar installed throughout the country from October 2017 through June 2018, the Trump Tariffs imposed a $236.5 million tax on residential solar customers.
Solar prices decrease nationally, but increase in some states
Nationally, the average quoted cost of solar panels on the EnergySage Marketplace decreased by one cent per watt from the second half of 2017 to the first half of 2018, representing a slow-down from cost declines in previous years. Nationally, the “payback period” for solar remained below 8 years – not a bad return on a 25- to 35-year investment!
Interestingly, solar customers in states where the cost of solar was below the national average in the second half of 2017 experienced an increase in quoted solar prices in the first half of 2018. In all but one of these states, though, the quoted cost of solar remained below the national average in 2018.
| State | H2 2017 | H1 2018 | % Change |
|---|---|---|---|
| New York | $3.38 | $3.23 | -4.4% |
| California | $3.22 | $3.17 | -1.6% |
| Texas | $2.94 | $2.93 | -0.3% |
| Rhode Island | $3.44 | $3.45 | 0.2% |
| Massachusetts | $3.28 | $3.29 | 0.3% |
| North Carolina | $2.97 | $3.06 | 3.0% |
| Ohio | $2.79 | $2.88 | 3.2% |
| Michigan | $3.02 | $3.14 | 4.1% |
| Indiana | $2.71 | $2.84 | 4.6% |
| Florida | $2.53 | $2.71 | 7.1% |
| Arizona | $2.68 | $2.89 | 7.8% |
| Maryland | $2.74 | $3.04 | 10.9% |
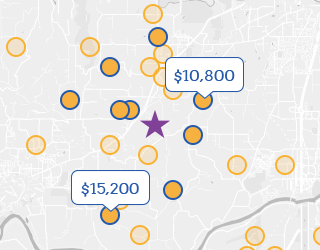
Although prices have continued to fall nationally, delaying your solar panel purchase will not necessarily save you more money. In the coming months and years, a number of states will see financial incentives reduced as solar installations increase, while a number of utilities have proposed updated rate structures that may make solar less cost-effective. If you’ve been thinking about installing solar but haven’t started shopping yet, now is the time to start comparing quotes for free from installers near you.
Solar interest grows in every state
Property owner interest in solar energy continues to be on the rise throughout the country. In the report, we find that every state in the country witnessed an increase in solar interest between the second half of 2017 and the first half of 2018, based on EnergySage data.
Interestingly, the growth in interest in solar did not just occur in traditionally solar-rich states (such as in the southeast and southwest), but rather all across the country. Many of the states with the largest growth in solar interest recently revised or announced plans to update their solar policies.
Curious how the cost of solar is changing in your state or looking for updated information on state-level incentives where you live? Check out EnergySage’s state-specific data pages to see how your state compares.
Looking for more solar insights?
If you’d like to see more analysis from EnergySage data, download the latest Solar Marketplace Intel Report™ on our data page. If you’re ready to take advantage of the favorable economics of solar in your state, join the EnergySage Marketplace to receive multiple quotes for free from pre-screened solar installers, allowing you to go solar with confidence.