


One of the best resources for tracking trends in the solar industry was just released. The recently published annual Tracking the Sun report from Lawrence Berkeley National Lab (LBNL) describes price and technology trends for distributed solar projects nationally, collecting project-level data from approximately 1.6 million systems through the end of 2018. The latest edition of the report, which is now in its twelfth year, finds that prices for distributed solar power systems continued to fall in 2018, that industry practices continue to evolve, and that systems are getting bigger and more efficient.
If you’re interested in learning more, the report, along with an accompanying slide deck, summary data tables, and a public version of the underlying dataset, is at trackingthesun.lbl.gov. The report authors will summarize key findings from the report via webinar on November 12, at 10 am Pacific / 1 pm Eastern: register here.
LBNL provided an overview of the key takeaways from the report for EnergySage, which we’ve posted below:
Solar prices continue to fall nationally
Analyzing yearly data for roughly 80% of the more than 2 million distributed solar systems in the US, Tracking the Sun finds that solar prices continued to fall through 2018 and into 2019, with national median installed prices dropping 5-7% across the market, continuing trends seen over the past five years. Installed prices in 2018, before any incentives, were $3.70 per Watt for residential, $3.00/W for small non-residential, and $2.40/W for large non-residential systems.
Installed price trends over Time

And as prices drop, customers are buying bigger and more efficient systems. Median system sizes in 2018 grew to 6.4 kilowatts (kW) for residential, meaning an investment of around $24,000 for the average homeowner. Systems also put out more energy per Watt due to higher panel efficiencies, which rose a full percentage point to a median of 18.4% among systems installed last year. The report also covers system design trends, including panel orientation, combining solar with batteries, and the use of module-level power electronics, such as microinverters and power optimizers to improve the output of solar panel systems.
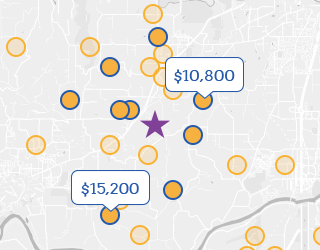
Solar prices vary from state to state
Prices were not uniform nationally, with residential systems ranging from a low of $2.80/W in Wisconsin to a high of $4.40 in Rhode Island. State differences are primarily a result of local market conditions, such as market size and competition, and can also be driven by differences in permitting and interconnection processes, taxes, and incentives. Direct cash incentives–in the form of rebates or performance-based incentives–have phased out in most of the major markets, and dropped to less than 50¢ per Watt elsewhere.
Installed Price of 2018 Residential PV Systems by State

Prices can also be affected by system size, the type of solar panel, inverter, and mounting/racking installed, the location, installer, and more. In this year’s edition, Tracking the Sun offers a new analysis to help identify the impacts of these individual pricing drivers, including characteristics of the local PV market related to market size, competition, and installer experience, among other factors.
More shoppers are purchasing their solar panels than ever before
While some customers choose to buy the power rather than the equipment, and have a third party own their system, this trend has declined recently: third-party ownership of systems dropped to 38% of residential systems in the sample in 2018. Tax-exempt customers, such as schools, government, and nonprofit organizations, made up a disproportionately large share (roughly 20%) of all non-residential systems.
Compare your solar options on EnergySage
EnergySage note: For Tracking the Sun, Berkeley Lab collects data primarily from state agencies and utilities that administer solar incentive programs, renewable energy credit (REC) registration, or interconnection processes. In our most recent Solar Marketplace Intel Report, EnergySage compared the quoted cost of solar on our Marketplace in 2018 to the installed cost of solar reported in the Tracking the Sun database. Due to increased competition and transparency, as well as the time lag between receiving quotes and installing solar, quoted solar costs on EnergySage were an average of 26% lower than the reported installed cost nationally. To see how much solar would cost you, register for a free account on the EnergySage Marketplace.