


In case you missed it, solar has been in the news quite a bit recently: the Biden Administration announced a goal for solar to produce 40% of the nation’s electricity by 2030; the Department of Energy released a corresponding Solar Futures Study that lays out just how to reach that lofty goal; the inclusion of clean energy incentives (including for solar!) is at the forefront of the debate around the infrastructure and budget reconciliation bills; the latest Solar Market Insight report from the Solar Energy Industries Association (SEIA) and Wood Mackenzie just dropped; and we recently released our own biannual Marketplace Intel Report. There’s a lot going on!
Amidst this solar news frenzy, Lawrence Berkeley National Laboratory (LBNL) just released their annual Tracking the Sun report, the best resource for tracking the state of residential solar installations in the U.S., and complete with publicly-available data sets with info on nearly 80 percent of all of the solar panel systems installed in the country. Here are some of the highlights from the report:
Key takeaways
- LBNL’s Tracking the Sun report is an annual review of solar panel systems installed in the last year, analyzing data from 2.2 million projects, or about 80 percent of all distributed solar projects in the country.
- In 2000, the average project was a $30,000, 2.4 kilowatts (kW) project, while in 2020 the average project was a $25,000, 6.5 kW project.
- Storage adoption is increasing, with storage included in 8 percent of residential solar installations in the country.
- Get started with your own solar project on EnergySage today!
Solar prices keep falling, while system sizes keep increasing
Between 2000 and 2020, the median installed cost of solar dropped from $12.35 per Watt ($/W) to $3.82/W in the U.S., a nearly 70 percent decrease over 20 years. The long term decline of an average of $0.43/W per year has slowed since 2014 or so, but solar prices continue to decline.
Over the same time frame, the average installed system size for residential solar projects grew from 2.4 kilowatts (kW) in 2000 to 6.5 kW in 2020. In other words, in 2000, the average project was a $30,000, 2.4 kW project, while in 2020 the average project was a $25,000, 6.5 kW project. Pretty cool!
How does this compare to EnergySage quote data?
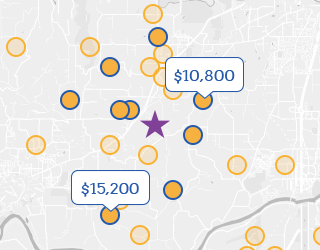
In 2020, the average system size on EnergySage was a 10 kW project and the median cost of solar was $2.85/W in the first half of the year and $2.75/W in the second half of the year, lower than the 20th percentile band of installed costs nationwide.
Solar equipment continues to advance technologically
Over the last two decades, solar equipment has become both less expensive and more technologically advanced: according to LBNL, median solar panel efficiency has increased from 13.4 percent in 2002 to 19.8 percent in 2020, or an average increase of just under a half of a percentage point per year. This pace of change is truly remarkable.
As a point of comparison, when the National Renewable Energy Laboratory (NREL) published their 2010 Solar Technologies Market report, the absolute maximum efficiency achieved in commercially available solar panels was 19.3 percent, while today, the median efficiency of solar panels installed in the U.S. is 19.8 percent.
How does this compare to EnergySage quote data?
We’ve seen an increase in the rated power (Wattage) and efficiency of solar panels quoted through our Marketplace: in 2020, the average solar panel quoted through our Marketplace was a 340 W solar panel, up from a 300 W solar panel in 2015.
Storage adoption is taking off
Energy storage installations are truly heading up and to the right: data from the Energy Storage Association and WoodMackenzie show how residential storage installations increased steadily quarter-over-quarter from Q1 2019 through Q1 2021. Solar installation data from LBNL’s Tracking the Sun report confirms this trend: nationwide, 8 percent of residential solar installs included a battery in 2020, up from just 1 percent in 2017.
How does this compare to EnergySage quote data?
Basically the same! We saw a 9 percent storage attachment rate on projects selected on EnergySage in 2020. Interestingly, that percentage is already up in 2021–to 14.5 percent nationwide–and even more robust among solar shoppers who ask for storage quotes when they first join EnergySage: in 2021, the attachment rate of storage among solar shoppers who requested storage quotes is 27 percent!
Despite price decreases, solar is more expensive in the U.S. than elsewhere in the world
One of the most interesting takeaways from this year’s Tracking the Sun report is the comparison between solar prices in the U.S. and in other countries around the world. In fact, according to LBNL’s review of solar prices and IRENA’s Renewable Cost Database, “installed prices in the U.S. are more than double those in most other countries.” While it’s unclear exactly why this is the case, most theories center on higher “soft costs” in the U.S.
How does this compare to EnergySage quote data?
We’re only in the U.S., so we can’t compare to the prices in other countries – at least not yet! But we do know that soft costs are high in the U.S. and initiatives like NREL’s SolarApp+ (and even EnergySage!) hope to change that.
Third party ownership continues to decrease in popularity
Finally, this year’s report tracks the continued decline in third-party-owned (TPO) solar panel systems–i.e., leases or PPAs–in residential solar installations in the U.S. In fact, TPO is down from 59 percent of systems in 2012 to 35 percent last year.
How does this compare to EnergySage quote data?
On EnergySage, we’ve seen loan products improve over time, meaning there’s a new way for people to go solar: you can now access the benefits of owning your own solar panel system with $0 down out of pocket. So far this year, the most frequently quoted loan product on EnergySage was a 12-year, 2.99 percent APR loan in the first half of 2021.
Join the 3 million solar homeowners in the U.S. with EnergySage
If you’re looking for evidence that solar is a good investment, look no further than the 3 million homeowners who have already installed solar in the U.S.! It’s easy to get in on the fun of not paying an electricity bill with solar: when you sign up for a free account on EnergySage, we’ll gather you custom solar quotes for your property from reputable solar companies in your area. So what are you waiting for? Get started exploring your solar savings with EnergySage today!